WTI Price Analysis: 21-day EMA restricts short-term downside
- WTI struggles to justify the first daily close below 10-day EMA in three weeks, sidelined of late.
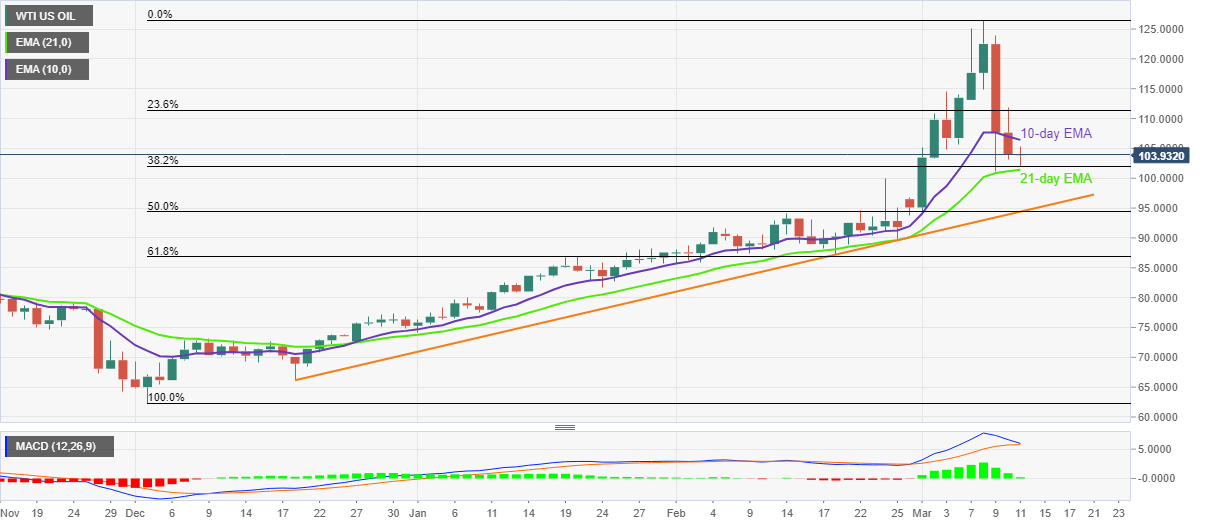
- Receding bearish bias of MACD keeps sellers hopeful.
- Convergence of ascending trend line from December, 50% Fibonacci retracement appears tough nut to crack for bears.
WTI treads water around $103.90 heading into Friday’s European session, following the first daily closing below short-term key EMA in several days.
In addition to the sustained close below the 10-day EMA, an impending bear cross of the MACD line and the signal line also favor sellers.
However, a clear downside break of the 21-day EMA level of $101.40 becomes necessary to convince the oil bears.
Even so, an upward sloping trend line from December 20, 2021, joins 50% Fibonacci retracement of December-March upside to restrict the quote’s downside around $94.50. Also acting as a downside filter is the $100.00 threshold.
On the flip side, a daily close beyond the 10-day EMA, around 106.45 by the press time, will direct the WTI crude oil buyers towards the 23.6% Fibonacci retracement level surrounding $111.40.
Following that, the $120.00 round figure and the latest multi-month high around $126.50 will lure the commodity bulls.
Overall, WTI crude oil is expected to decline further but the bullish trend is here to stay.
WTI: Daily chart
Trend: Further weakness expected