WTI Price Analysis: Bulls step back from 50-DMA around monthly top
- WTI consolidates the biggest daily gains in three week to ease from one-month high.
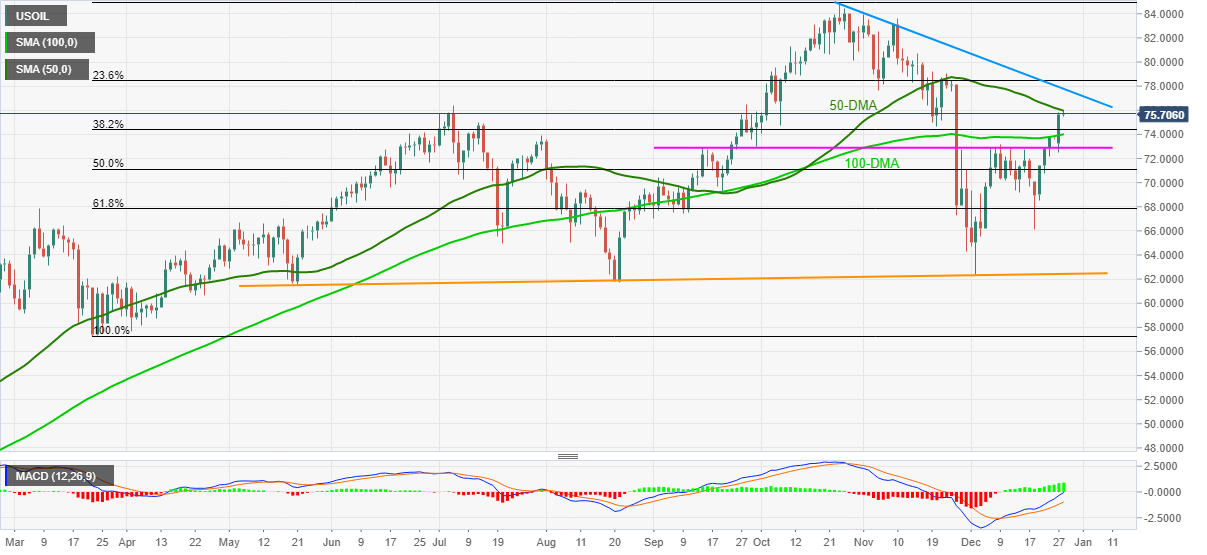
- Bullish MACD signals, sustained trading beyond 100-DMA favor buyers.
- Two-month-old resistance line challenge further upside, bears need validation from $72.80.
WTI crude oil, also known as US oil, seesaws around monthly high, down 0.15% intraday near $75.55 during Tuesday’s Asian.
In doing so, the black gold eases from the 50-DMA after rising the most since December 06 the previous day.
Even so, firmer MACD signals and a clear upside break of the 100-DMA keep WTI bulls hopeful to overcome the $76.00 immediate hurdle.
Following that, a descending trend line from October 25, around $77.80, will be in focus as it holds the gate for the commodity’s further rally targeting the yearly top marked in November around $85.00.
Meanwhile, pullback moves may aim for the 100-DMA level of $74.00 and horizontal support from mid-September near $72.80.
In a case where oil bears break the $72.80 support, the odds of witnessing further downside towards the $70.00 threshold can’t be ruled out.
WTI: Daily chart
Trend: Further upside expected