Gold Price Forecast: XAU/USD breaks $1,785 support confluence ahead of Fed
- Gold remains on the back foot, extends previous day’s losses.
- Options market turns most bearish in three months as market braces for Fed tapering.
- Fed November Preview: Gold needs a dovish surprise to overcome key hurdle
Gold (XAU/USD) pares intraday losses around $1,782, following a downside break to the key support during early Wednesday. In doing so, the yellow metal justifies the bearish Risk Reversals (RR) to drop for the second consecutive day ahead of the all-important US Federal Reserve (Fed) meeting.
Market’s indecision ahead of the Fed’s verdict could be linked to the mixed headlines over US stimulus and inflation expectations, not to forget fresh fears of the COVID-19 third wave.
Although US President Joe Biden keeps teasing a deal on the much-awaited $1.75 trillion aid package this week, Senator Joe Manchin conveyed a less likely announcement before Thanksgiving, per CNN. Elsewhere, US inflation expectations, as measured by the 10-year breakeven inflation rate per the St. Louis Federal Reserve (FRED) data, snapped a four-day downtrend to bounce off the lowest levels since October 12 by the end of Tuesday’s North American trading.
It’s worth noting that the recent jump in the covid numbers in China, New Zealand and the UK challenges market sentiment with Bloomberg terming Beijing’s latest covid outbreak as the widespread since the Wuhan incident.
On a different page, the one-month risk reversal of gold, a measure of the spread between call and put prices, dropped the most since early August to -0.725, per the latest Reuters data. The same hints at the escalating bearish bias among the gold traders before crucial market events, namely the Fed.
In addition to the Fed, the US ADP Employment Change, ISM Services PMI and Factory Orders will also entertain the gold traders. However, major attention will be on how much tapering the US central bank manages to agree upon considering the fresh covid fears and reflation woes.
Technical analysis
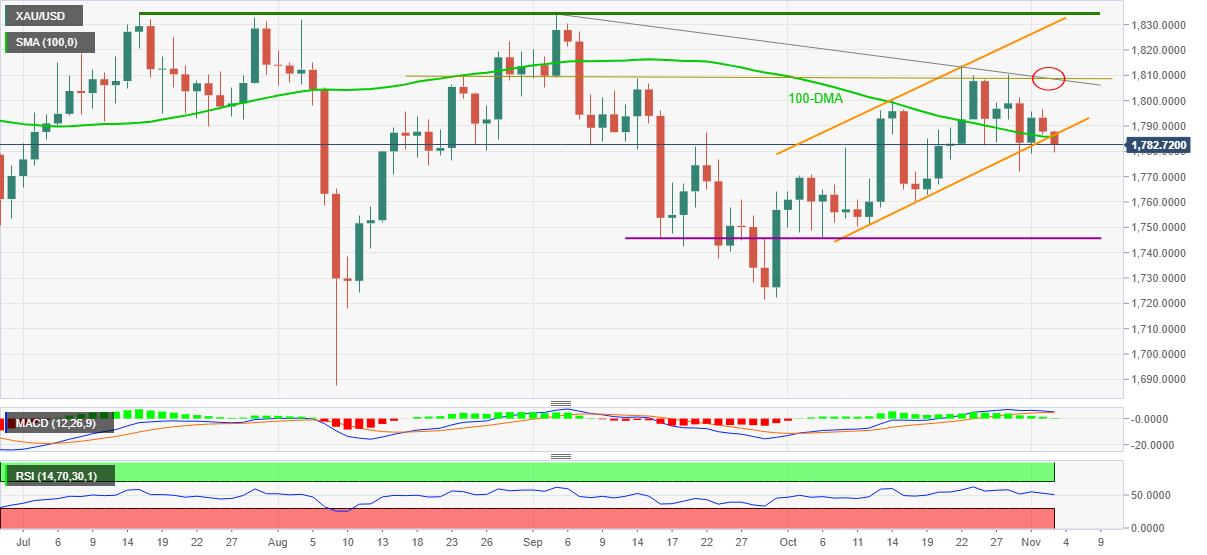
Gold defies a three-week-old ascending trend channel, also slipped below 100-DMA, while printing $1,781 as a quote amid receding bullish bias of the MACD and descending RSI line.
Given the rejection of the bullish chart pattern, backed by bearish oscillators, gold prices are likely to decline towards an early October’s swing high near $1,770.
Following that, a horizontal area comprising multiple levels marked since September 16, near $1,745, holds the gate for the bullion’s further weakness target’s September’s low near $1,721.
On the flip side, a corrective pullback beyond $1,785 support confluence, now resistance, could trigger the run-up to a $1,810 level comprising a two-month-long descending trend line and a horizontal line from late August.
In a case where the gold buyers manage to conquer the $1,810 hurdle, the upper line of the short-term bullish channel near $1,824 becomes crucial for the run-up to the “double top” marked in July and September around $1,834.
To sum up, a clear downside break of a short-term rising channel lures gold bears ahead of the Fed’s verdict.
Gold: Daily chart
Trend: Further weakness expected