USD/IDR Price News: 100-day SMA challenges Indonesian Rupiah bears near one-month low
- USD/IDR rises to the highest since July 20.
- RSI conditions join 100-day SMA to probe the pair bulls.
- 50-day SMA, two-month-old ascending trend line offer important support.
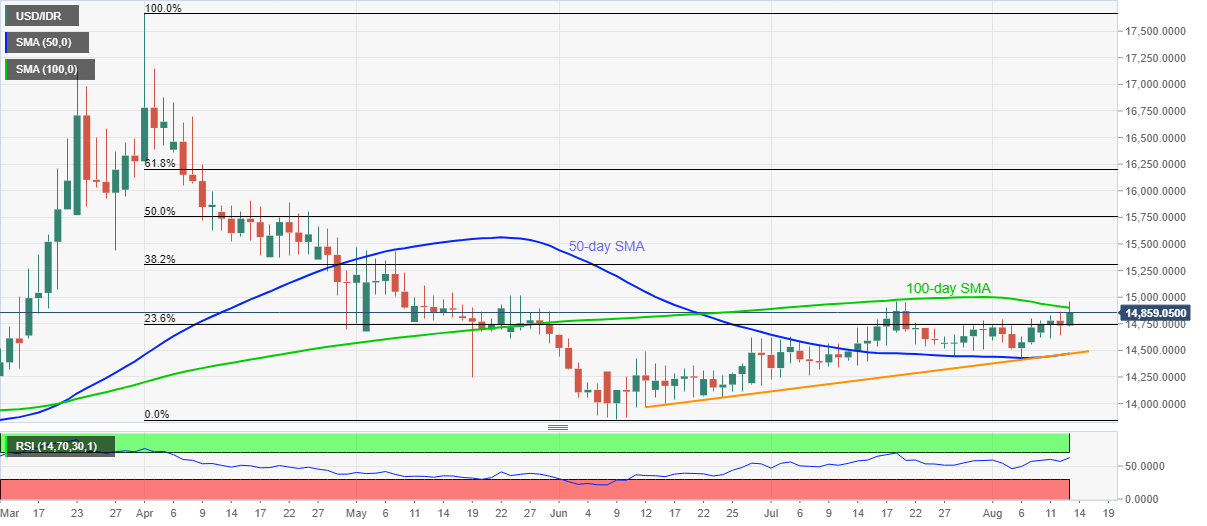
USD/IDR recedes from intraday top to 14,857, up 0.84% on a day, during the pre-European session on Thursday. The pair currently trades around month’s high but 100-day SMA seems to chain the bulls amid nearly overbought RSI conditions.
As a result, the quote is likely to witness a pullback towards 23.6% Fibonacci retracement of April-June downside, at 14,746.
However, the pair’s further downside will be limited by a confluence of an ascending trend line from June 12 and 50-day SMA around 14,470.
Should the quote slips below 14,470, 14,350 and July month bottom near 14,260 will be on the bears’ radars.
Meanwhile, the pair’s sustained break above 100-day SMA level of 14,900 will need validation from July month’s top of 14,958.70 before attacking the 15,000 threshold.
USD/IDR daily chart
Trend: Pullback expected