GBP/USD Price Analysis: Off intraday top under 1.2600, short-term triangle in focus
- GBP/USD fails to extend recoveries from 1.2550 beyond 1.2572.
- 200-bar SMA offers immediate support inside one-week-old symmetrical triangle.
- Lower high formation since July 09 suggests bulls losing momentum.
GBP/USD recedes to 1.2562 amid the initial Asian trading on Monday. The Cable eases from 1.2572 in its latest downside while keeping a four-day-old triangle pattern. Even so, the pair’s failures to refresh the monthly high of 1.2670, coupled with the lower highs since then, keep the sellers hopeful.
Hence, the bears can target a 200-bar SMA level of 1.2533 ahead of confronting the triangle’s support of 1.2518. Though, any clear break below the same will not refrain from attacking 50% Fibonacci retracement level of June 29 to July 09 upside, at 1.2460.
During the pair’s further weakness past-1.2460, 1.2400 round-figures and June 29 top near 1.2390 becomes the key.
On the upside, a clear break past-1.2593 resistance could propel the pair towards breaking 1.2600, which in turn will eye the monthly high near 1.2670.
It should, however, be noted that the June 16 top near 1.2690 and 1.2715 might challenge the bulls afterward.
GBP/USD four-hour chart
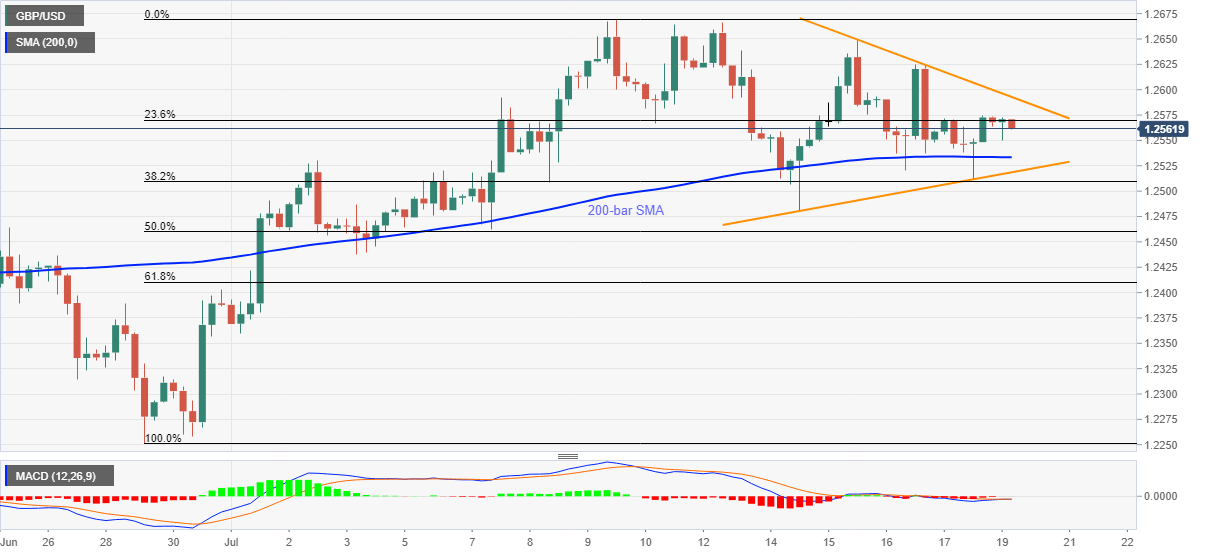
Trend: Sideways