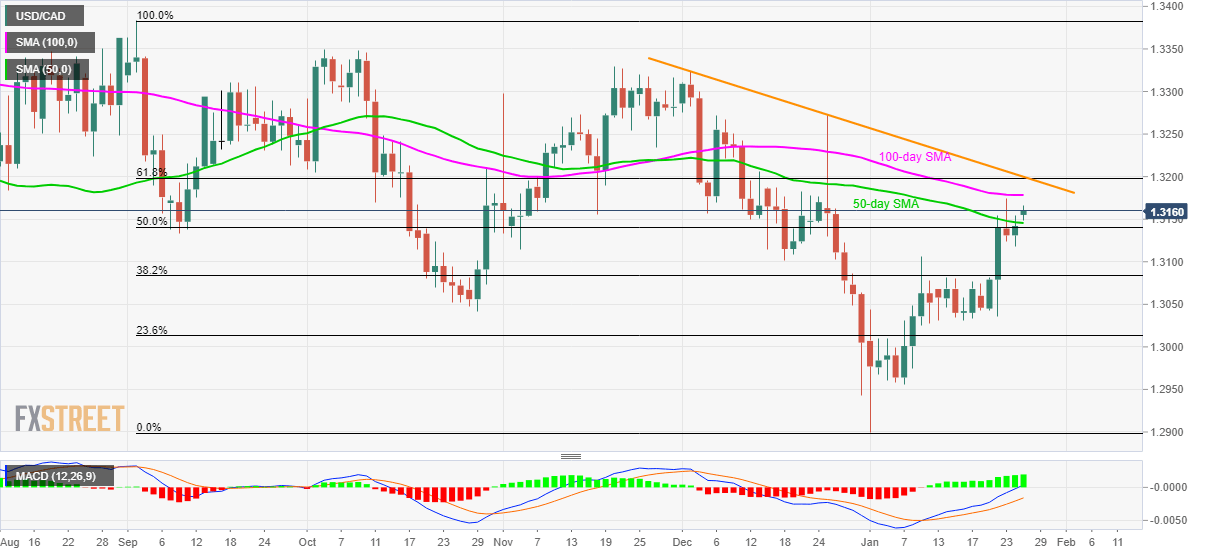
USD/CAD Price Analysis: 1.3200 becomes the tough nut to crack for buyers
- The eight-week-old falling trend line, 61.8% Fibonacci retracement guard the pair’s near-term upside.
- Sustained break of 50-day SMA propels the quote to 100-day SMA.
- The early-month top could challenge sellers during the pullback.
USD/CAD takes the bids to 1.3160 while heading into the European open on Monday. The pair recently crossed 50-day SMA for the first time since early-December. With this, prices are likely to confront 100-day SMA.
Even so, a confluence of a multi-week-old resistance line from December 03 and 61.8% Fibonacci retracement of the pair’s September 2019 to January 01 declines can challenge the bulls around 1.3200.
Should buyers concentrate more on the bullish MACD signals and cross 1.3200 on a daily closing basis, December month’s high near 1.3320 will return to the charts.
Alternatively, 50-day SMA and 50% Fibonacci retracement could restrict the pair’s immediate declines near 1.3145/40, a break of which could push the quote towards January 09 top near 1.3105.
During the pair’s south-run post-1.3105, also below 1.3100 round-figure, multiple stops around 1.3080 can question the bears targeting 1.3030 and 1.3000 psychological mark.
USD/CAD daily chart

Trend: Pullback expected
