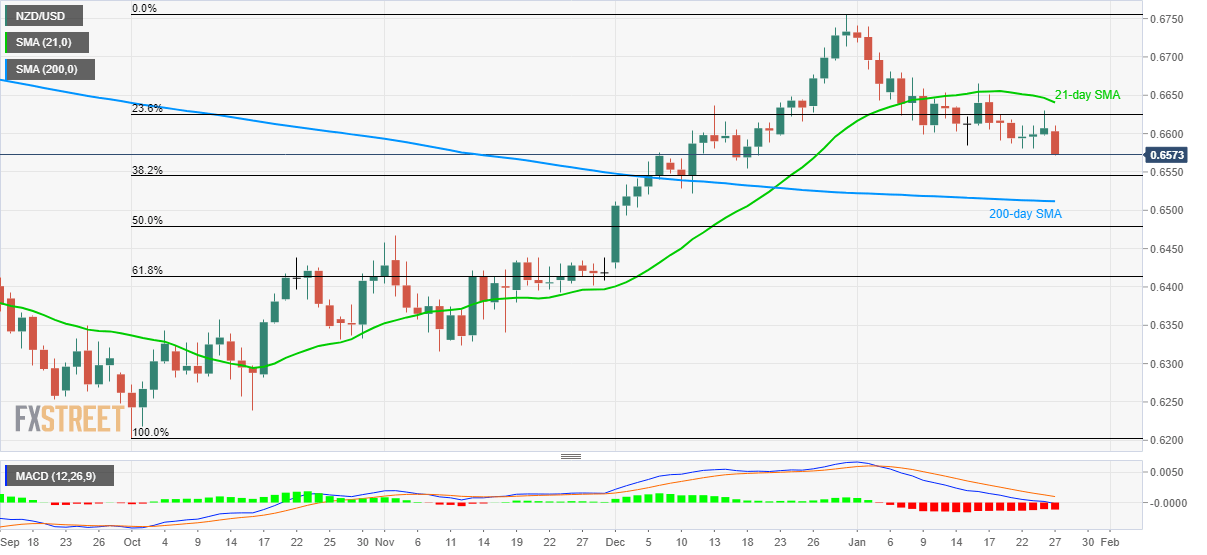
NZD/USD Price Analysis: On its way to 200-day SMA
- NZD/USD drops to the lowest since December 18, 2019.
- 38.2% Fibonacci retracement can offer intermediate support.
- 21-day SMA caps short-term upside.
NZD/USD declines to the fresh multi-week low while flashing 0.6572 as the quote during early Monday. The pair failed to extend its latest recovery beyond 23.6% Fibonacci retracement of its October-December 2019 upside.
With this, prices are likely to keep the bears happy with 38.2% Fibonacci retracement level of 0.6545 acting as a buffer amid the fall towards a 200-day SMA level of 0.6512.
Should there be additional downpour past-0.6512, the November month top close to 0.6465 will return to the charts.
Alternatively, pair’s another attempt to cross 23.6% Fibonacci retracement level of 0.6625 can again defy the buyers unless 21-day SMA, at 0.6641 now, gets a break on the daily closing basis.
In doing so, the bulls can take aim at 0.6700 and December 31, 2019 high near 0.6755.
NZD/USD daily chart

Trend: Bearish
