GBP/USD Technical Analysis: 1.3180 holds the key to further upside
- GBP/USD nears the May month top while showing a little momentum off-late.
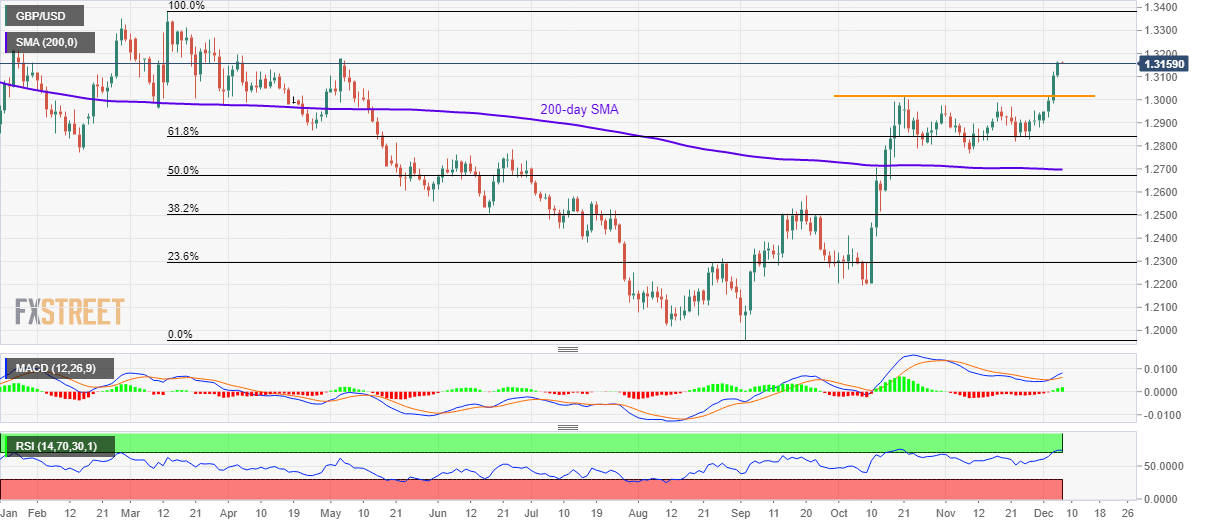
- Bullish MACD, sustained trading beyond October top support further upside.
- Overbought RSI, May month high keep sellers hopeful.
GBP/USD traders modestly changed around 1.3160 by the press time of early Asian session on Friday. That said, overbought conditions of the 14-day Relative Strength Index (RSI) and the recent stop in north-run make buyers doubtful.
As a result, sellers can look for entry below Wednesday’s high surrounding 1.3120 to revisit the 1.3015/10 region comprising October month high.
However, pair’s further declines can well divert the Bears to 61.8% Fibonacci retracement of March-September fall, at 1.2840.
Meanwhile, buyers are waiting for a sustained break of May month high of 1.3178, coupled with validation of further upside by pair’s rise past-1.3180, to target 1.3200 and 1.3270 numbers to the north. Increasing the odds of pair’s run-up are bullish signals from 12-bar Moving Average Convergence and Divergence (MACD).
It should also be mentioned that Bull’s dominance beyond 1.3270 enables them to challenge the yearly top, marked in March, surrounding 1.3385.
GBP/USD daily chart
Trend: Pullback expected