Back
14 Oct 2019
GBP/USD technical analysis: Cable bouncing from daily lows and challenges the 1.2600 handle
- GBP/USD starts the week retracing part of the massive gains seen last weeks.
- GBP/USD is now battling with the 1.2600 handle in the last part of the London session.
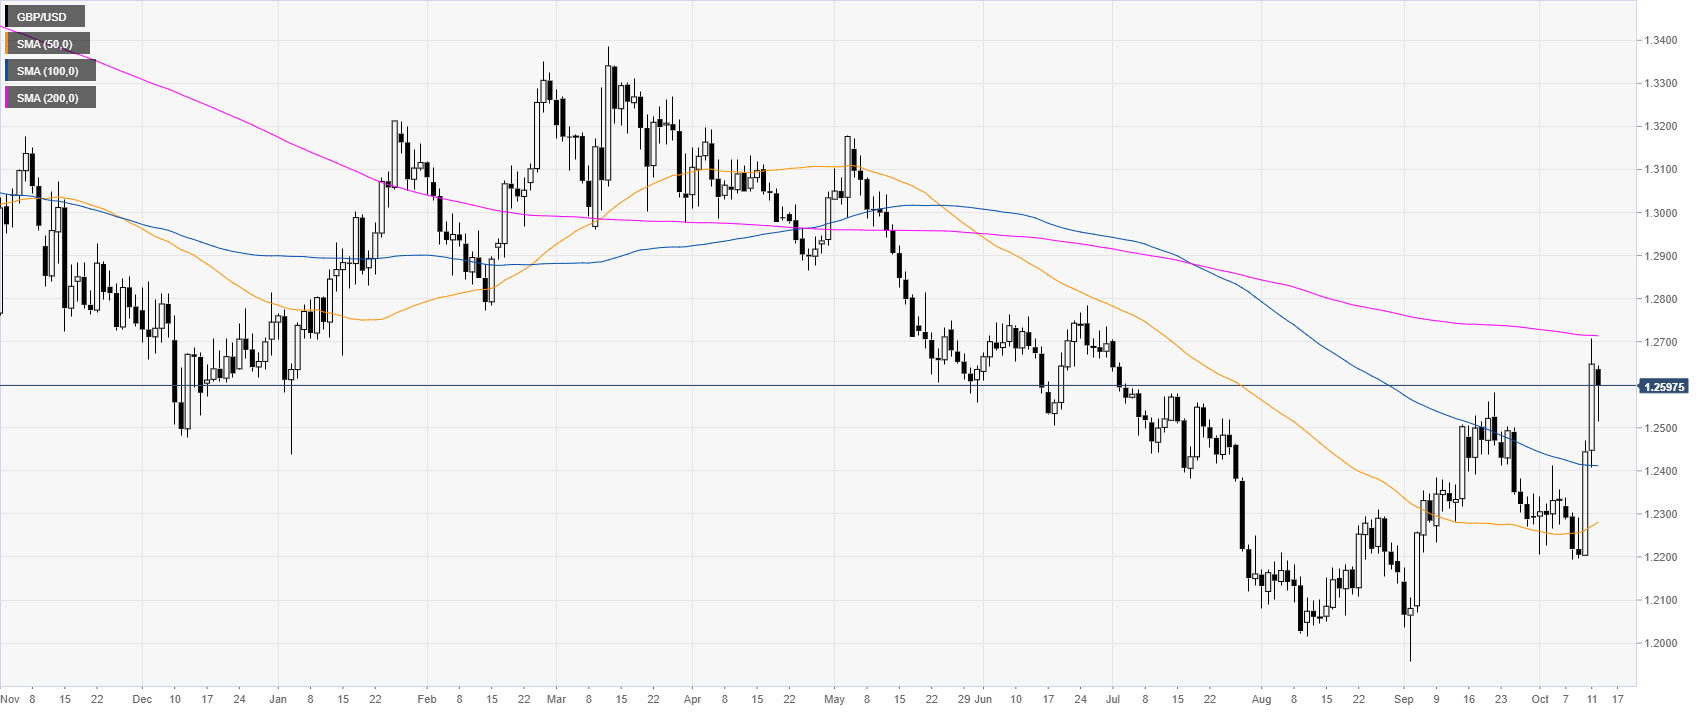
GBP/USD daily chart
The Cable, on the daily chart, is trading in a bear trend below its 200-day simple moving average (DSMA). This Monday, the market is consolidating last week's sudden spike related to Brexit deal optimism.
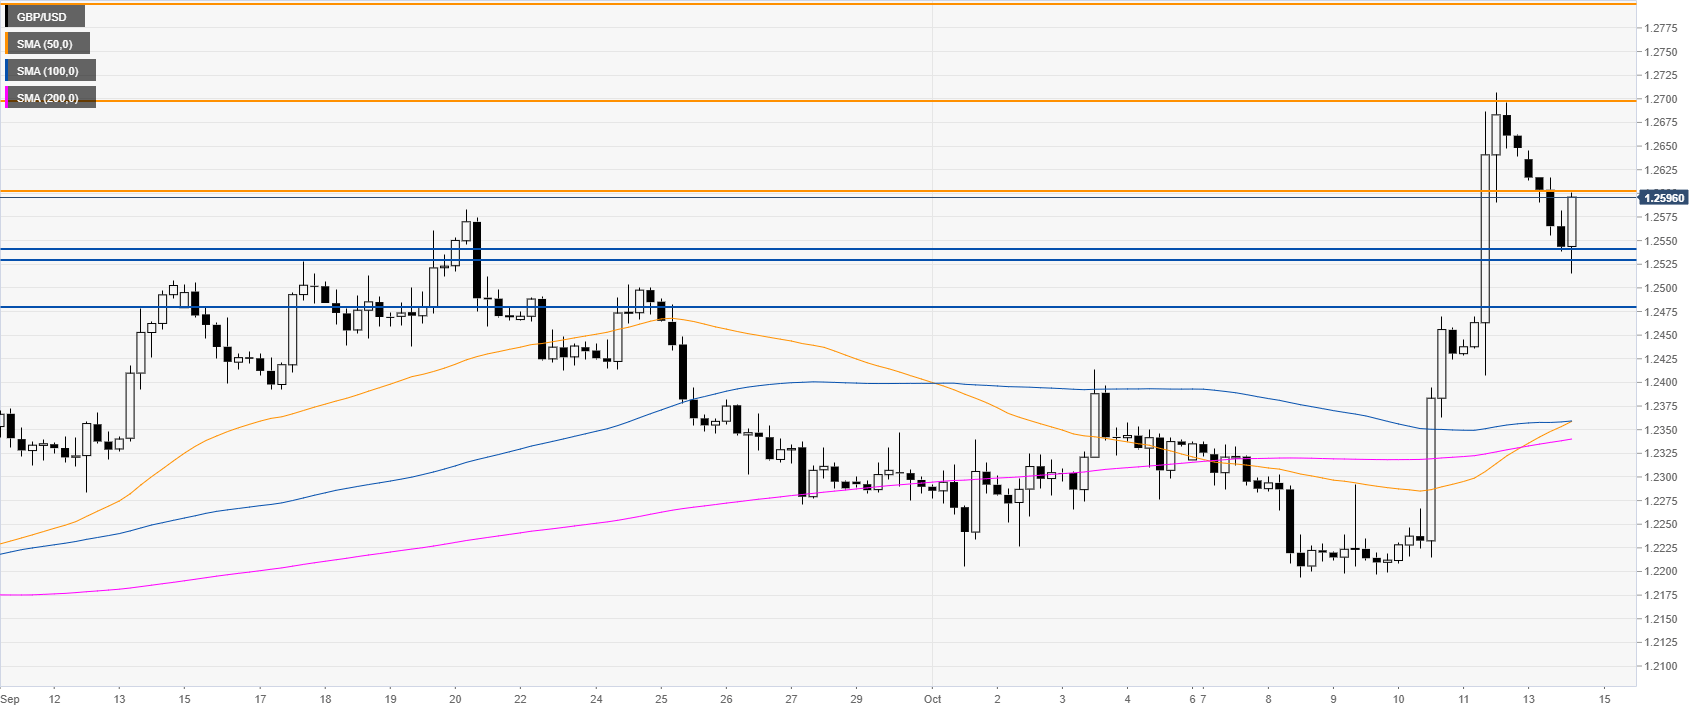
GBP/USD four-hour chart
GBP/USD is challenging the 1.2600 handle in the last part of the London session. If the market breaks above this level, the next resistance of interest can be the 1.2700 handle, according to the Technical Confluences Indicator.
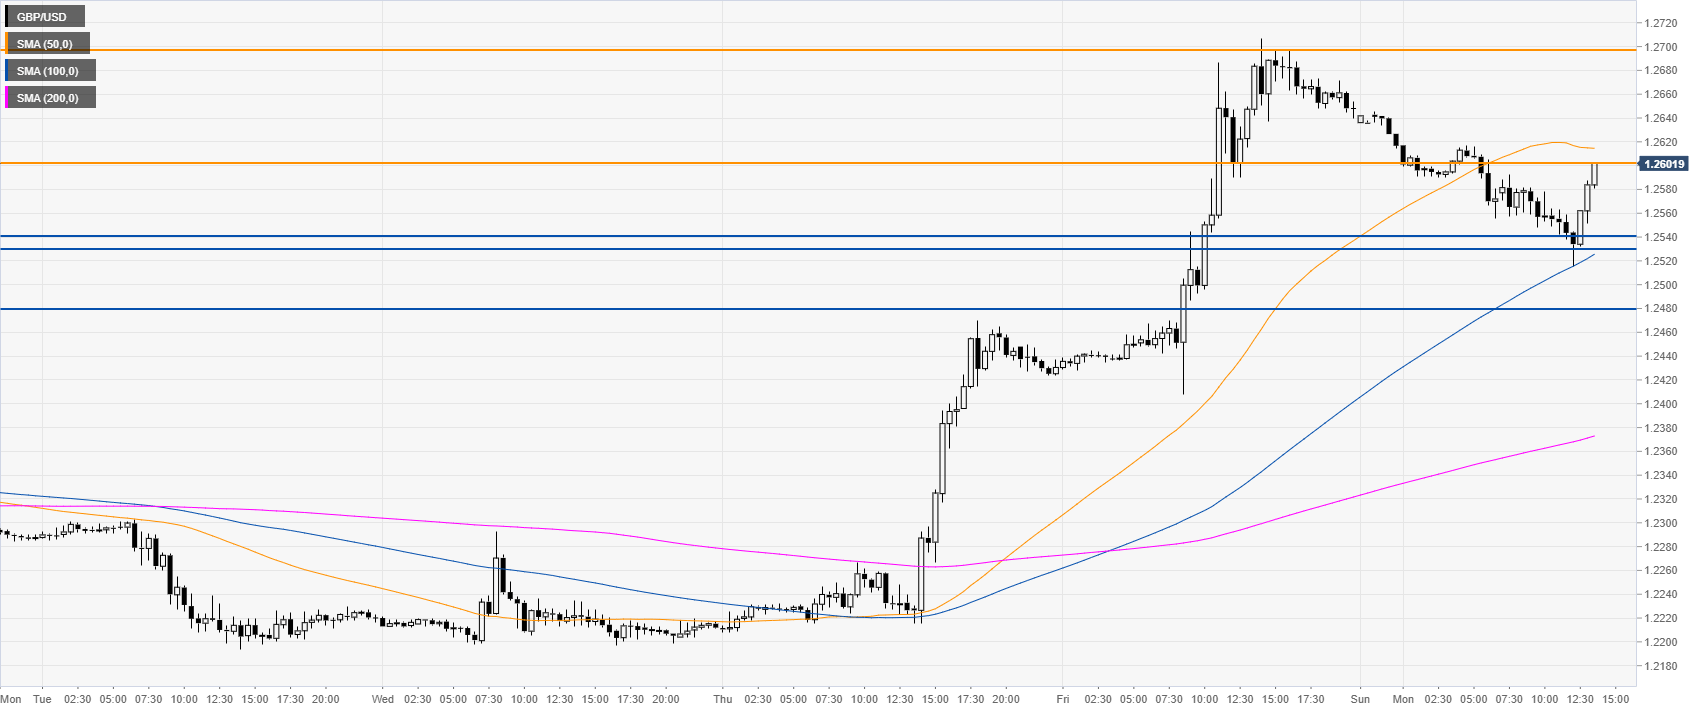
GBP/USD 30-minute chart
The Sterling is trading above the 100 and SMAs, suggesting bullish momentum in the near term. Support is seen at the 1.2543/30 zone and the 1.2477 level, according to the Technical Confluences Indicator.
Additional key levels