Back


28 Aug 2019
GBP/USD technical analysis: Cable erases parts of intraday losses, trading sub-1.2260 level
- GBP/USD is off the August high after hitting 1.2310 on Tuesday.
- The levels to beat for bears are seen at 1.2211, followed by 1.2173 support levels.
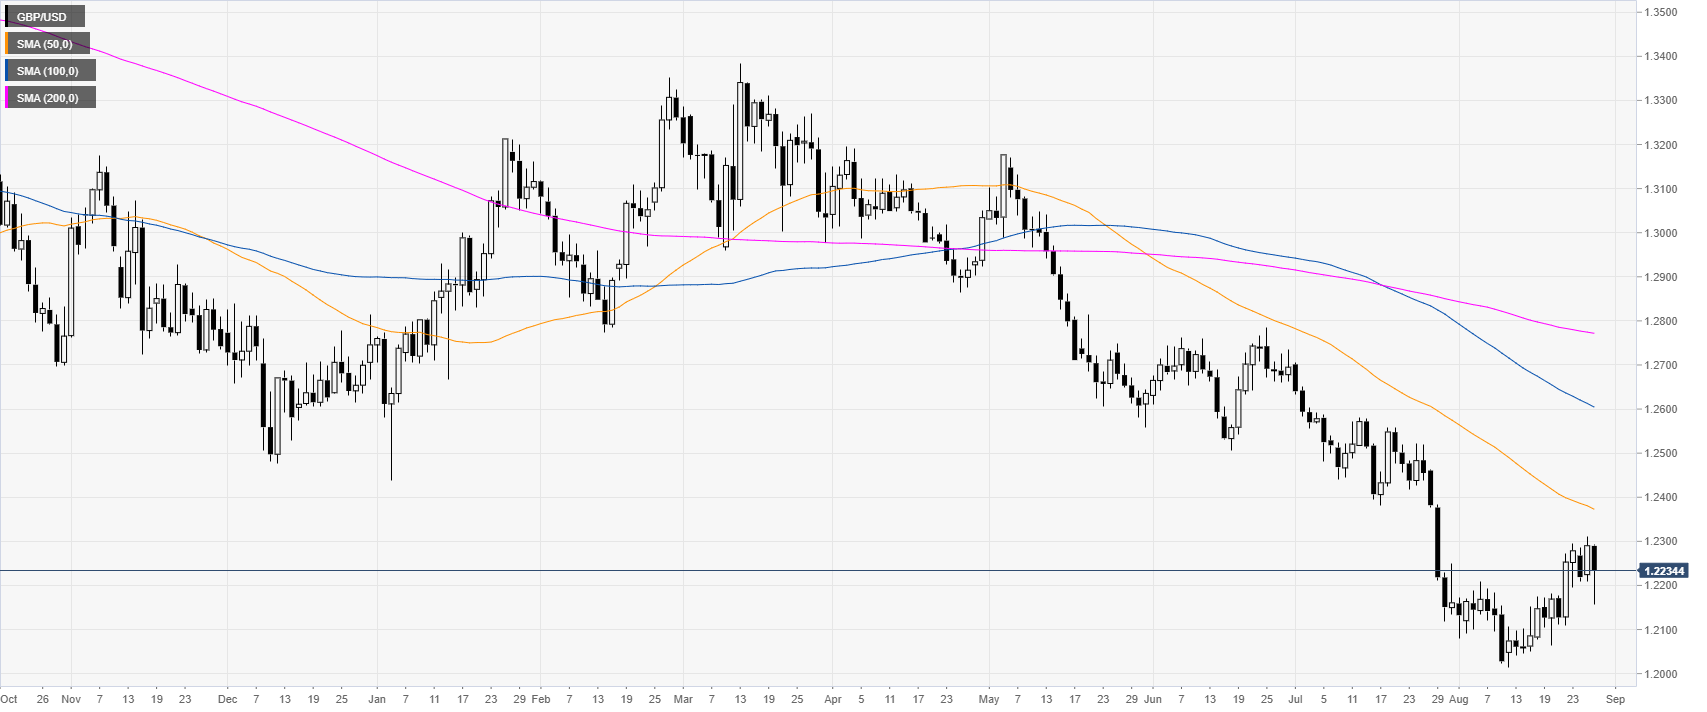
GBP/USD daily chart
GBP/USD is in a bear trend below the main daily simple moving averages (SMAs). However, in the last two and a half weeks, the Cable has been reversing up after printing a 2019 low at the 1.2015 level.

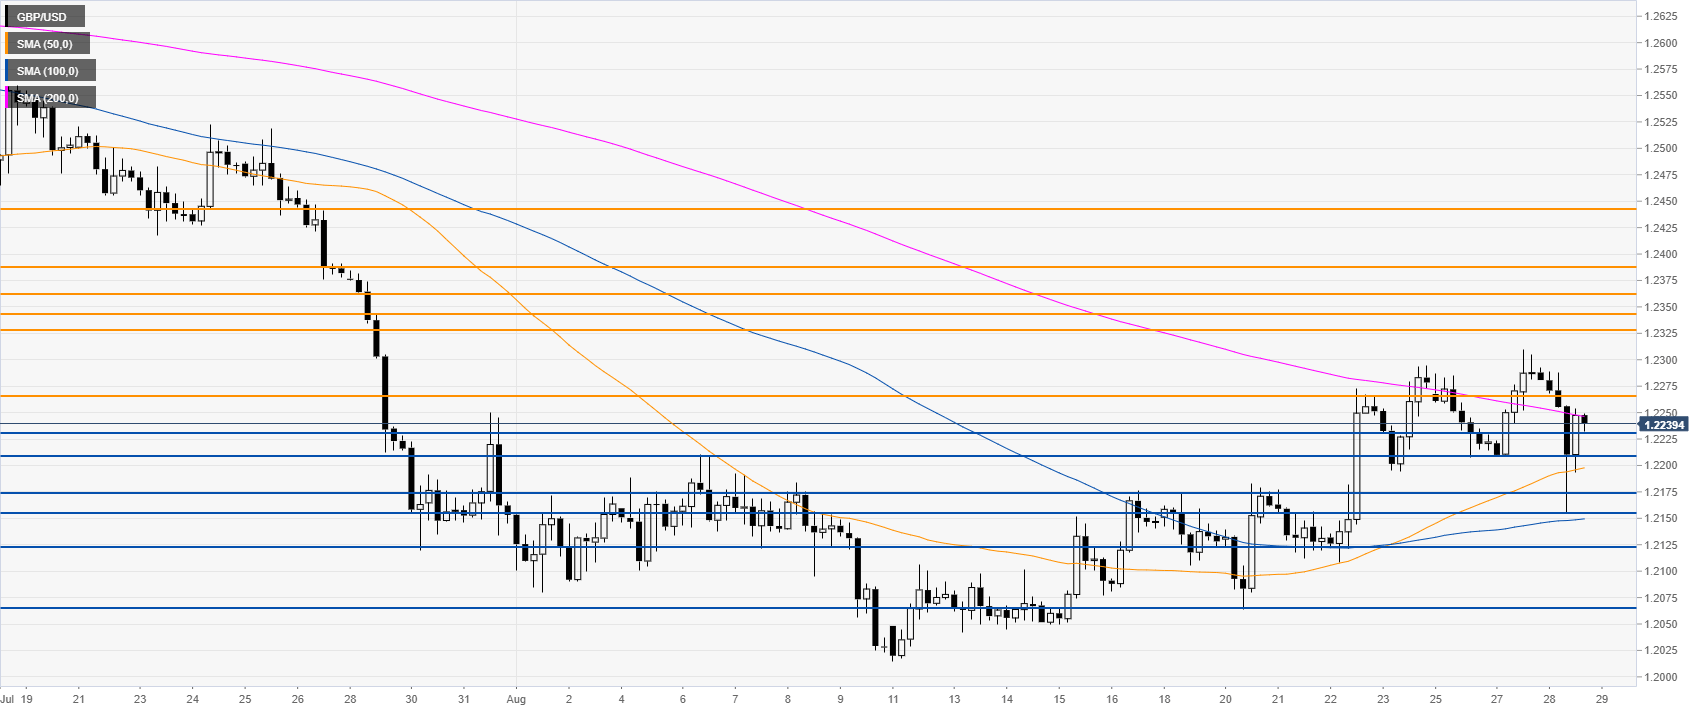
GBP/USD 4-hour chart
The Cable is trading between the 200 SMA (on the 4-hour time frame) and the 1.2230 support as the market is consolidating the recent spike down. Bears could come back and drive the market below the 1.2230 support towards 1.2211, 1.2173, 1.2122 and 1.2065 levels, according to the Technical Confluences Indicator.

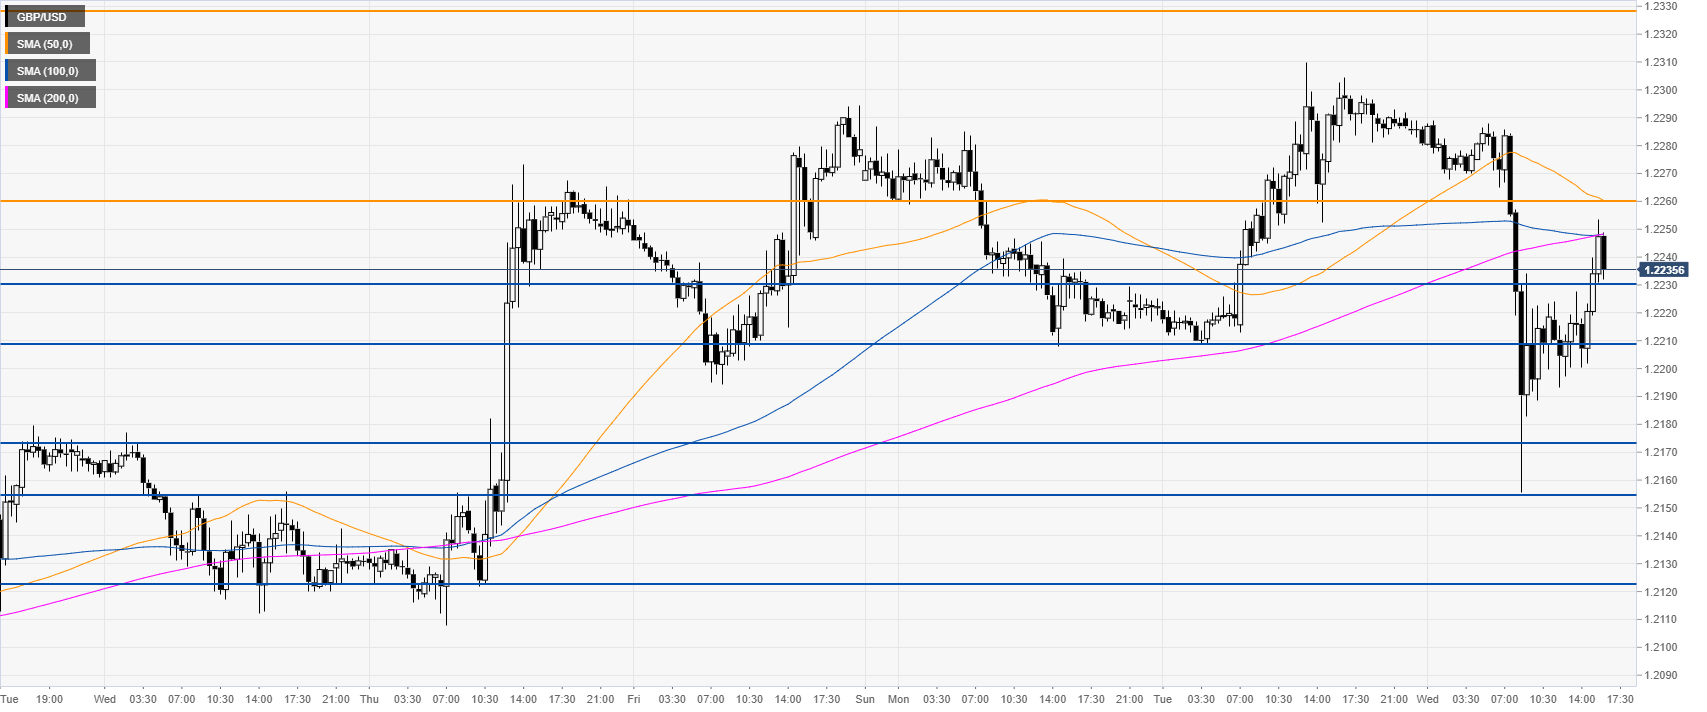
GBP/USD 30-minute chart
GBP/USD is trading just below its 100/200 SMAs, suggesting bearish momentum in the near term. Strong resistance is seen at the 1.2260 level, according to the Technical Confluences Indicator.

Additional key levels
