Back
24 May 2019
GBP/USD technical analysis: Cable recovering after the selloff near the 1.2700 figure
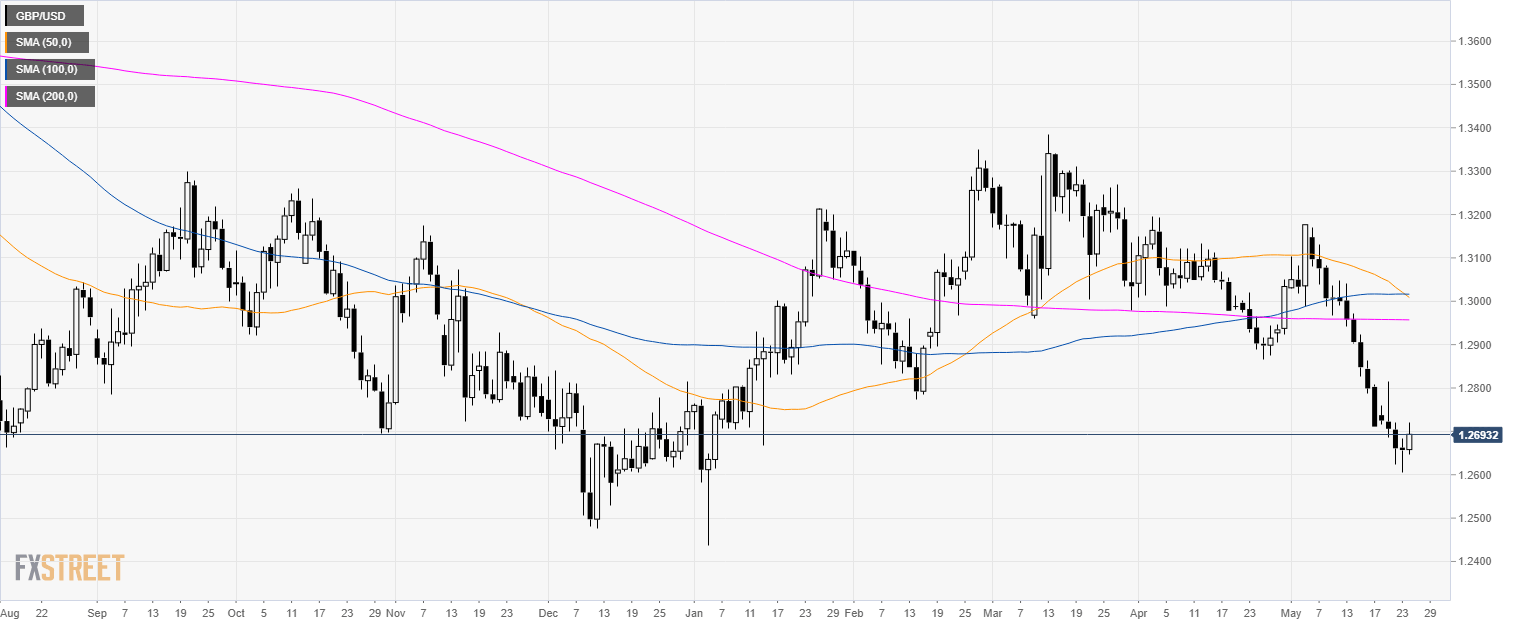
GBP/USD daily chart
GBP/USD has been under intense selling pressure in the last weeks of trading as the Brexit headlines pushed the currency pair down.
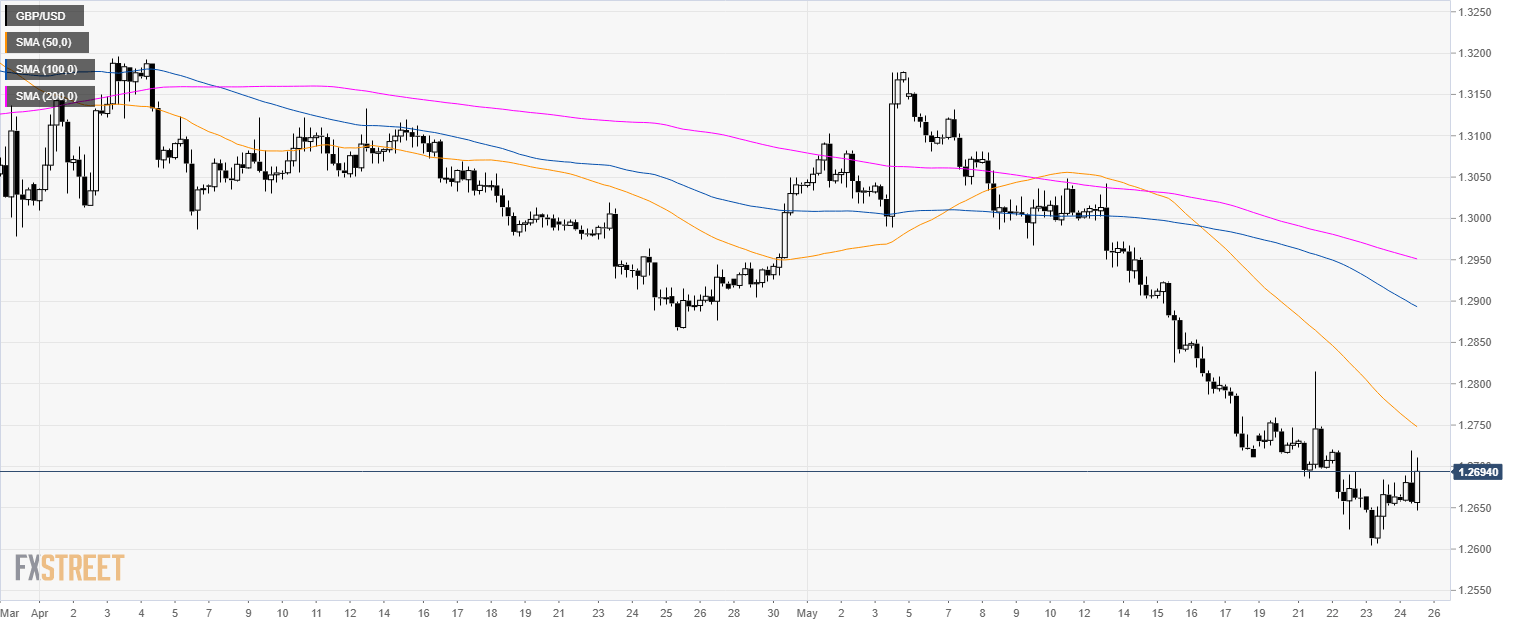
GBP/USD 4-hour chart
GBP/USD is trading below its main simple moving averages a suggesting bearish momentum in the near term.
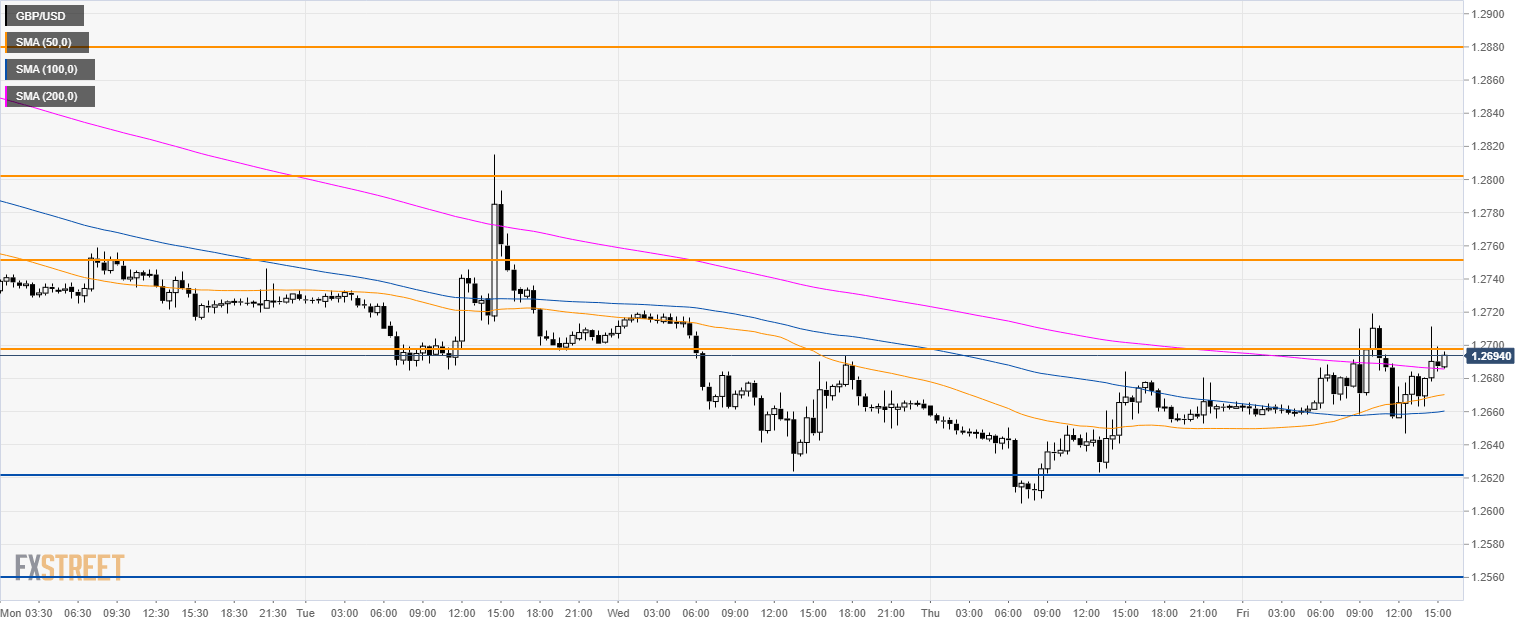
GBP/USD 30-minute chart
The bulls are challenging the 1.2700 figure as the market is trying to hold on above the 200 SMAs. A bullish break above 1.2700 can lead to 1.2750 and 1.2800 figure next week. Support is seen at 1.2620 and 1.2560 levels.
Additional key levels