Back
18 Feb 2019
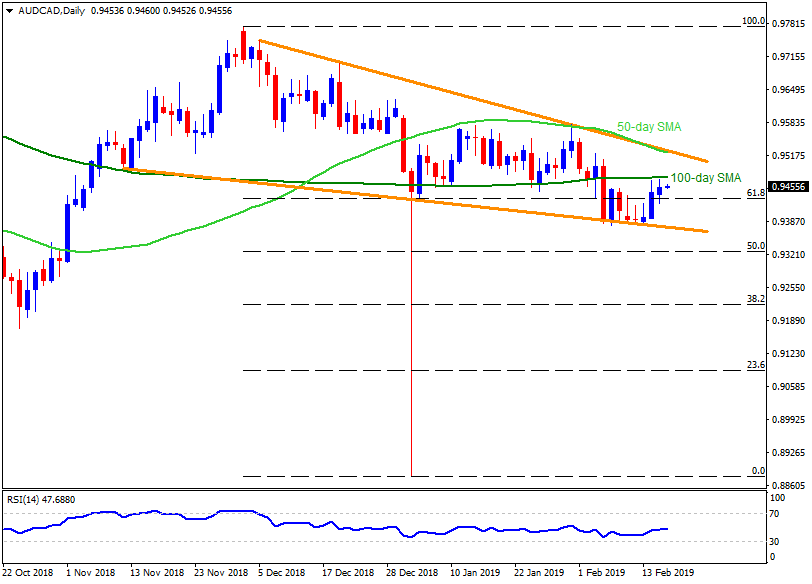
AUD/CAD Technical Analysis: 0.9475 becomes immediate barrier to the upside
- The AUD/CAD pair trades around 0.9460 at the start Asian trading on Monday.
- The pair has been struggling to clear the 100-day simple moving average (SMA), currently at 0.9475, since Thursday.
- Should the pair manage to conquer the 0.9475 upside barrier, it can surpass 0.9500 round-figure to head towards 0.9515 resistance.
- However, 50-day SMA and a descending trend-line connecting highs since December 05 can confine the pair’s further advances at 0.9525.
- If at all prices rally beyond 0.9525, they confirm a short-term “falling wedge” bullish formation and can escalate the upmoves to 0.9525 and 0.9630 numbers to north.
- Meanwhile, 61.8% Fibonacci retracement of its December to January downturn, at 0.9430, could become nearby support for the pair.
- Given the quote slips under 0.9430, 0.9400 and a downward sloping trend-line, at 0.9370, seem crucial levels to watch for sellers.
- Also, pair’s daily closing under 0.9370 might not hesitate flashing the 50% Fibo level 0.9325 and 0.9300 supports back on the chart.
AUD/CAD daily chart
AUD/CAD
Overview:
Today Last Price: 0.9462
Today Daily change: 0.0001 pips
Today Daily change %: 0.01%
Today Daily Open: 0.9461
Trends:
Daily SMA20: 0.947
Daily SMA50: 0.9537
Daily SMA100: 0.9485
Daily SMA200: 0.9561
Levels:
Previous Daily High: 0.9473
Previous Daily Low: 0.9423
Previous Weekly High: 0.9473
Previous Weekly Low: 0.9382
Previous Monthly High: 0.9646
Previous Monthly Low: 0.9161
Daily Fibonacci 38.2%: 0.9454
Daily Fibonacci 61.8%: 0.9442
Daily Pivot Point S1: 0.9432
Daily Pivot Point S2: 0.9402
Daily Pivot Point S3: 0.9382
Daily Pivot Point R1: 0.9482
Daily Pivot Point R2: 0.9502
Daily Pivot Point R3: 0.9532