Gold Technical Analysis: Struggling to build on falling channel breakout
Gold convincingly crossed the falling channel hurdle on Friday, signaling an end of the corrective pullback from recent highs above $1,325. So far, however, the bull breakout has not emboldened the bulls.
4-hour chart
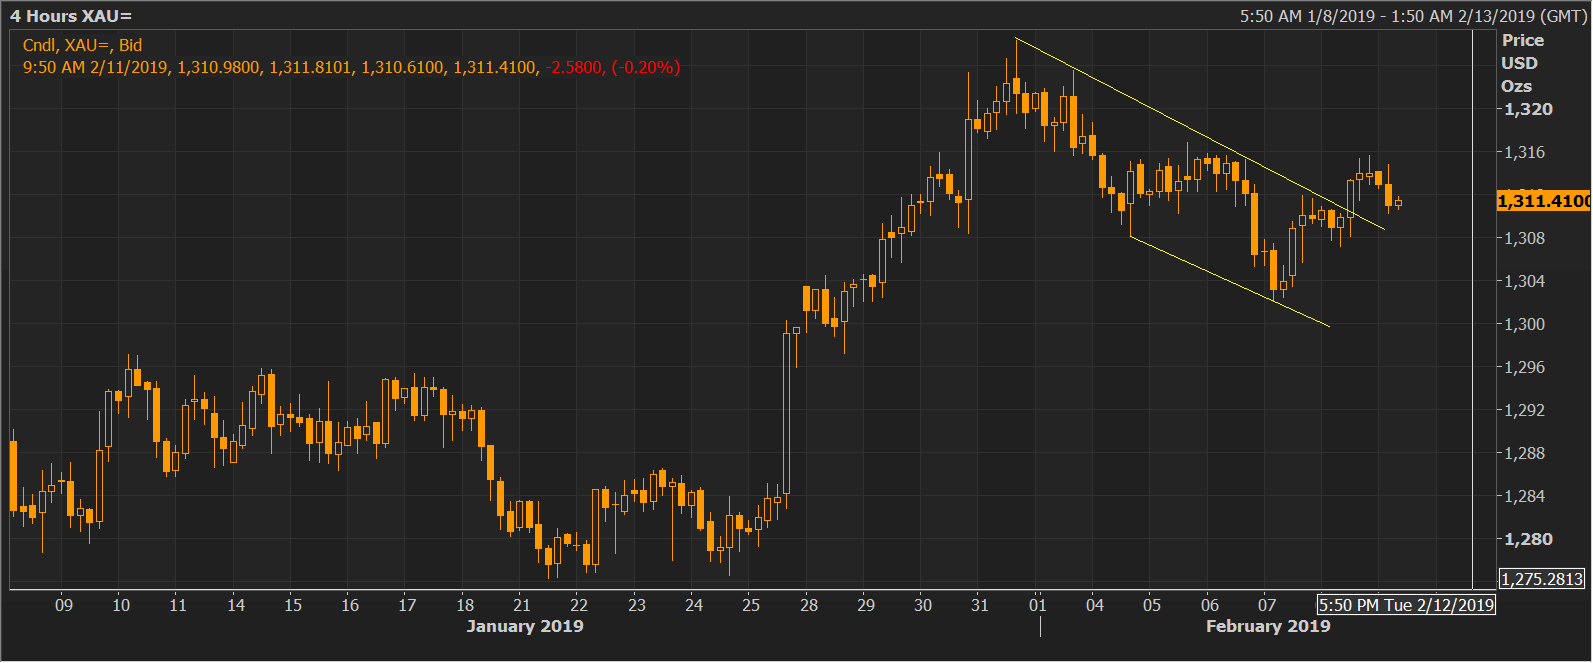
The falling channel breakout seen in the above chart represents a bearish-to-bullish trend change. Put simply, the doors have been opened for a test of the recent high of $1,326.
The yellow metal, however, is still trading below Friday's high of $1,315. That is a slight cause for concern for the bulls, although the outlook would turn bearish only below the Feb. 8 high of $1,307.
Trend: Cautiously bullish
XAU/USD
Overview:
Today Last Price: 1311.83
Today Daily change: -2.53 pips
Today Daily change %: -0.19%
Today Daily Open: 1314.36
Trends:
Daily SMA20: 1300.04
Daily SMA50: 1277.87
Daily SMA100: 1249
Daily SMA200: 1231.02
Levels:
Previous Daily High: 1315.7
Previous Daily Low: 1300.1
Previous Weekly High: 1322.3
Previous Weekly Low: 1300.1
Previous Monthly High: 1326.25
Previous Monthly Low: 1275.9
Daily Fibonacci 38.2%: 1309.74
Daily Fibonacci 61.8%: 1306.06
Daily Pivot Point S1: 1304.41
Daily Pivot Point S2: 1294.46
Daily Pivot Point S3: 1288.81
Daily Pivot Point R1: 1320.01
Daily Pivot Point R2: 1325.66
Daily Pivot Point R3: 1335.61